According to the US Department of Labor, the cost of a bad hire is 30% of an employee’s first-year earnings. Bad hire costs go beyond explicit and include tremendous implicit costs because of the ripple effect in the workplace. It takes a toll on the hiring manager, the morale of the colleagues, the product, and disrupts projects, and as a result, often extends into numerous costs of hiring a new person. Every company suffers from employees that are not a fit time and again with lasting implications. But how can organizations deploy dynamic recruitment strategies to avoid bad hires?
Recruitment Metrics
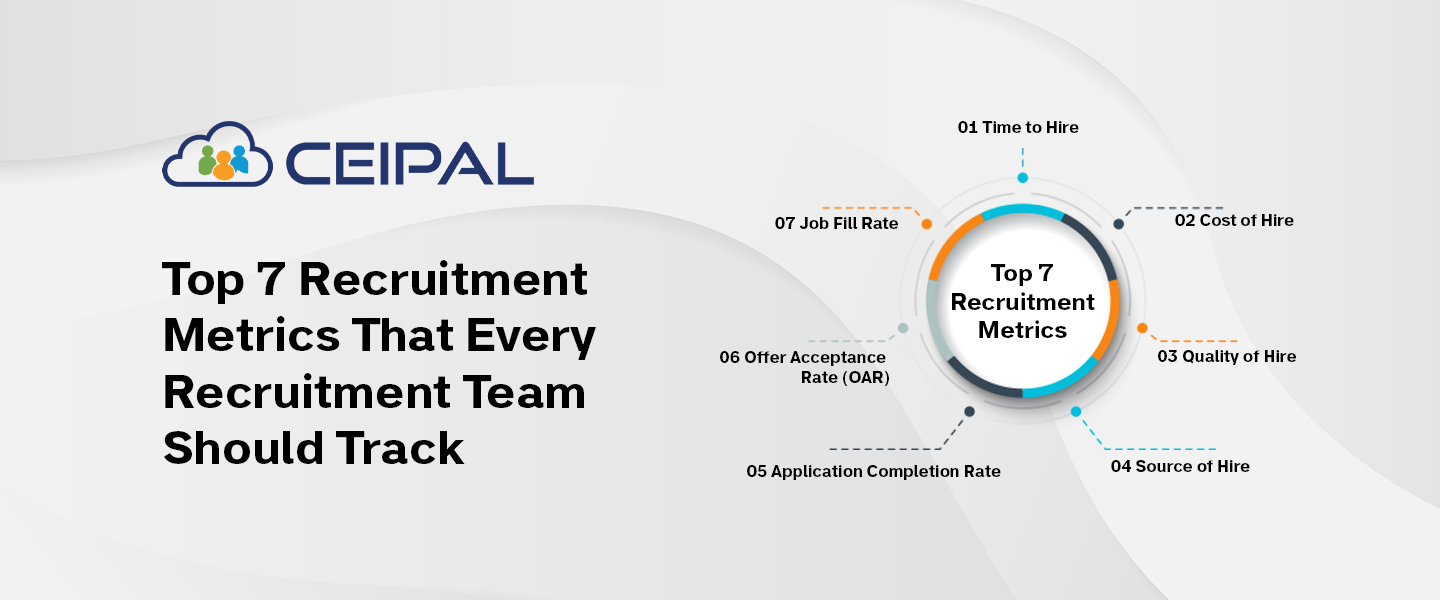
Recruiting is costly. It takes immense planning and execution to set up a hiring budget and a hiring team. But it is even more important to measure the recruitment impact that your team is making especially when there is so much money at stake. Attracting and retaining talent is vital to all organizations. Recruiting metrics are used to measure hiring performance, the success of the hiring teams, to calculate the returns (ROI) of business, and for reanalyzing their existing hiring structure. Here are a few recruitment metrics that every talent acquisition team should calculate:
- Time to Hire. The time-to-hire metric is used to measure the time/number of days taken to fill a position. This can be calculated from the day a job requisition is opened till an offer is made or the candidate accepted the offer. The time to hire varies depending on the industry. Gathering insights on time will help you analyze whether your recruitment team spends too much time or too little time to hire, and make required changes in the system.
- Cost of Hire. Cost-of-hire is one of the most relevant metrics that is taken into account by all talent acquisition leaders. Cost-per-hire determines the average spent on hiring a single candidate. This helps talent acquisition (TA) professionals to calculate the ROIs of their system.

Want to Source Candidates Like a Pro?
Read an eBook Designed for Smart Recruiters Like You
The Formula to determine cost-of-hire is-
Cost of Hire = Total Internal costs + Total External Costs / Total number of Hires
Wherein the internal costs include time-costs of recruiters, hiring managers, etc. The external costs include spending on applicant tracking systems (ATS), job advertising, job boards, new hire training costs, etc.
- Quality of Hire. Measuring the quality of hire is elusive and subjective to organizations, their employee expectations, and the industry. The quality of hire is often determined by the performance of the candidate in the first year of employment. Candidates with high ratings are considered to be successful hires. On the other hand, bad hires cost companies a lot of time and money. Although quality of hire is a common metric, it is also a complex process to determine the actual quality of hire by taking multiple channels into consideration.
- Source of Hire. Candidates enter the recruitment database through multiple channels and sources. Common sourcing channels include job boards, employee referral portals, career sites, social media, campus career centers, etc. Keeping track of candidate sources ensures that you are not wasting the time of recruiters and investing more in quality channels to build a bigger pipeline of candidates to hire faster. One of the easiest ways to track the source effectiveness is to use an ATS platform to look at the source tags of candidates.
- Application Completion Rate. Almost 80% of candidates do not finish their job applications. There are a lot of factors leading to candidate drop-offs such as lengthy application process, non-engaging experience, lack of follow-ups, lack of mobile friendliness, poor user experience, etc. A high number of candidate drop-offs indicates that the recruitment process needs improvement.
Application Completion Rate = Number of applications submitted / Number of applications started
- Offer Acceptance Rate (OAR). As the name suggests, the offer acceptance rate refers to the number of candidates accepting the job offers made to them. A higher OAR usually indicates that the team is successfully building a strong candidate pipeline and making placements with effectiveness.
Offer Acceptance Rate = Total number of offers accepted / Total number of offers made
Note: OAR offers the flexibility to calculate the rate, monthly, yearly, or for a given duration of time, unlike other metrics which are dependent on various other factors.
- Job Fill Rate. Job fill rate is the ratio of jobs filled by the recruiter, the team, or by the channel to the job assigned to the recruiter, team, or the channel. This metric helps companies identify the system that best matches their needs. It can be used to find out whether candidates are being filled by your internal team or the external agencies.
Job Fill Rate = Total number of jobs filled / Total number of jobs assigned
Setting Recruiting Benchmarks
The prime focus of recruiters should be to find qualified candidates. With lots of mundane tasks like cold calling candidates, and clients, and responding to all the candidates, recruiters often fail to keep a track of their activities. Deploying an ATS and relying on recruitment dashboards makes the life of recruitment teams much easier by readily available insights and stats on every activity. CEIPAL’s AI-powered dashboards allow recruiters to create customizable dashboards and build powerful and aesthetic reports that help talent acquisition leaders to benchmark their business and work towards finding better talent.